

Reporting data from multiple sources often becomes a copy-and-paste exercise. It is repetitive, time-consuming manual work that can be automated—as long as the data and the overall process are well organized. In my experience, however, successful reporting automation does not begin with technology. It begins with understanding what information is actually needed, who uses it, and what decisions the reporting is intended to support.
People are at the center of everything we do. Every person who creates data for AI to use acts as a gatekeeper. We can choose to see ourselves either as people who are losing work or as people who are leading work. Choose your battle.
From our perspective, reporting automation should first be viewed as the development of shared understanding and consistent ways of working, and only afterwards as a technical solution. When people understand what is being measured, why it is being measured, and how the information will be used, automation becomes significantly easier to build and implement.
This article first introduces the fundamentals of reporting automation, the available tools, and their different use cases. Finally, I share my perspective on how organizations should approach reporting automation in practice, particularly in the age of artificial intelligence.
Tanja Karonen
Key Takeaways
- Most reporting tasks are repetitive and error‑prone; automation removes this bottleneck.
- Automated tools deliver real‑time insights that strengthen decision‑making and collaboration.
- Companies can choose from a spectrum of tools— BI platforms, KPI dashboards, code‑light solutions, or custom setups — depending on their needs.
- Challenges such as security, adoption, and training are real but solvable with planning and governance.
What is Reporting Automation?
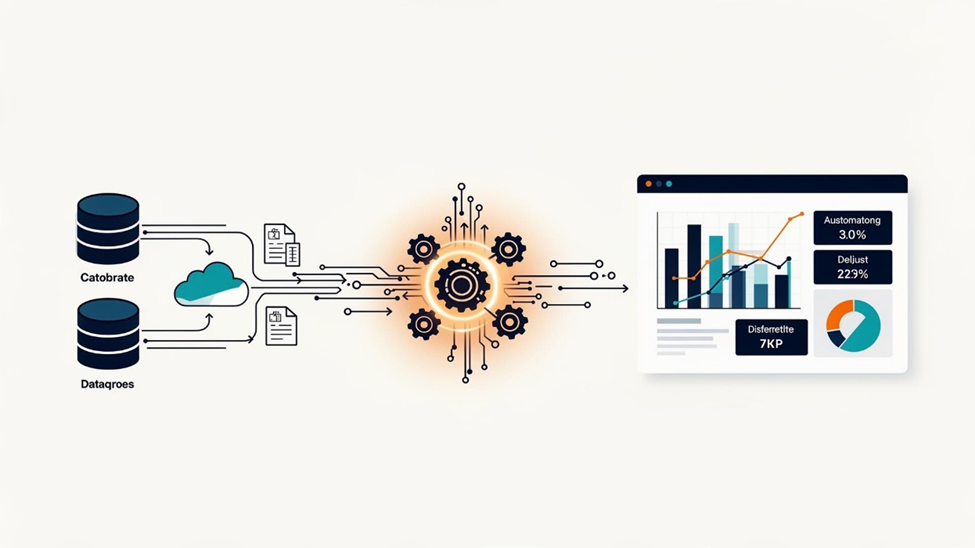
At its core, reporting automation means using software to collect, process, and present data without manual intervention. Instead of analysts spending hours copying numbers into spreadsheets, automated systems connect directly to data sources, clean and transform the information, and generate dashboards or formatted outputs on a schedule.
From a business perspective, the rationale is clear: manual reporting is becoming an outdated way to manage operations. Leadership needs standardized KPI metrics, analysts' time should not be spent compiling reports over and over again, and managers should be able to access the performance data for their own areas of responsibility whenever they need it.
Why is Reporting Automation Essential?
Manual reporting is not only time-consuming but also highly prone to errors. Even a single data entry mistake can distort results and undermine confidence in the information. Automated reporting addresses this challenge by retrieving data directly from source systems, reducing human error and ensuring greater accuracy. Organizations still produce many reports manually, including resource planning, rent rolls, project schedule tracking, financial reporting—you name it. There are countless project management and financial management systems available today, yet many of them still cannot generate the reports organizations need to support strategic decision-making. With today's technology, however, these reports can be produced with ease.
Benefits of AI-Powered Reporting:
- Efficiency: Reports that used to take hours to make can now be created in minutes.
- Improved accuracy: Centrally governed metrics eliminate “whose numbers are right?” debates.
- Real‑time insights: Dashboards update continuously, enabling quicker, proactive decisions.
- Better collaboration: Automated scheduling and cloud access let teams share and act on insights without endless email attachments.
- Employee morale: By removing repetitive tasks, teams can focus on strategic analysis rather than data busywork.
The conclusion is clear: automation strengthens confidence, clarity, and agency across the organisation. It ensures technology supports decision‑making rather than creating bottlenecks.
What are the Challenges of Reporting Automation?
Despite its advantages, reporting automation comes with challenges:
- Security: Automated tools handle sensitive data, so robust access controls, encryption, and compliance with standards like SOC 2 or GDPR are essential.
- Universal adoption: Employees may continue old habits, requesting manual reports instead of using the tool. Clear communication and standard responses from data teams help drive adoption.
- Training: Even user‑friendly platforms require onboarding. Training sessions ensure employees understand how to use tools effectively and reduce the learning curve.
- Data quality: Automation magnifies errors if source data is messy. Reliable pipelines and monitoring are critical to prevent broken dashboards or misleading insights.
- Scalability: As data volumes grow, tools must handle increased complexity without slowing down or creating hidden costs
What Tools to Use?
There is no single "right" tool for reporting automation. The best solution depends on where your reporting process is currently creating bottlenecks and slowing down operations.
- , such as **Python, Pandas, and Jupyter**, are well suited for technical teams that require a high degree of customization. They enable the development of highly sophisticated analytical models and automated reporting workflows. The trade-off is that these solutions require programming expertise as well as someone to maintain and support them over time.
- Analytics automation tools, such as Alteryx, are ideal for situations where the same data is repeatedly collected, cleaned, combined, and transformed. Their value is particularly evident when reporting involves a significant amount of manual preparation before the data is even ready for visualization.
- Self-service BI and reporting tools, such as Zoho Analytics, are designed for teams that want to create reports and dashboards without extensive technical implementation. They can be an excellent choice for smaller organizations or individual teams with clearly defined and focused reporting needs.
- Financial management systems, such as QuickBooks Online, are not true BI tools, even though they include reporting capabilities. They are well suited for core financial reporting tasks, such as tracking cash flow, expenses, invoicing, and profit and loss statements. However, if reporting needs to combine financial data with sales, customer, production, or HR information, a dedicated BI or analytics solution is typically required.
- BI tools, such as Power BI and Tableau, are designed for broader data-driven management. They allow organizations to combine data from multiple sources, create standardized KPI dashboards, and share real-time insights with executives, managers, and specialists. In practice, however, the greatest value comes not from the dashboard itself, but from ensuring that the metrics, data sources, and responsibilities are clearly defined before implementation begins.
- Advanced analytics platforms, such as Sisense and Domo, are well suited for organizations that want to embed analytics across multiple systems, business processes, or customer-facing services. Rather than serving as standalone reporting tools, they provide comprehensive platforms for leveraging data throughout the organization.
- Product and user analytics tools, such as Mixpanel, are particularly well suited for digital products and services. They help organizations track user journeys, conversion rates, user activation, and customer retention. These tools are not general-purpose KPI platforms for every industry; instead, they are most valuable when the goal is to understand how users interact with a digital product or service.
- KPI and dashboard tools, such as Datapine, focus on visualizing and monitoring key performance indicators. They can be an excellent solution when the underlying data is already well structured and the primary goal is to make organizational performance visible. However, if the data is fragmented or unreliable, a dashboard alone will not solve the underlying reporting challenges.
Simply put: if the challenge lies in processing data, a different type of tool is needed than if the challenge is visualizing metrics. And if reports are still being created manually in Excel, the first step is not necessarily to purchase a new tool—it is to review and optimize the existing reporting process.
Additionally, there are tools designed for specific use cases. For example, Supermetrics and Funnel.io are specifically built to consolidate marketing data from multiple channels, including Google Ads, Meta, LinkedIn, and website analytics platforms. Their main advantage is that they eliminate the need to manually collect data from various advertising and analytics tools.
In financial management, organizations often use reporting and planning tools integrated with ERP systems or accounting software. These tools help monitor budgets, forecasts, cash flow, and profitability. In this context, FP&A (Financial Planning & Analysis) refers to the processes of financial planning and analysis—including budgeting, forecasting, and management reporting that supports strategic decision-making.
There are also tools designed specifically for presentation creation and report formatting, such as UpSlide and Displayr. While they do not automate the entire reporting process, they help produce PowerPoint presentations, charts, tables, and client reports more quickly, consistently, and professionally.
The right tool depends on where the bottleneck in the reporting process lies. If most of the time is spent collecting data from different systems, organizations should look for solutions focused on data integration and consolidation. If the data is already reliable but difficult to interpret, the priority should be better dashboards and KPI visualizations. If, on the other hand, the greatest effort goes into assembling monthly presentations, the issue may not lie in analytics at all, but rather in the way reports are produced and presented.
This article was written with the assistance of artificial intelligence as part of an internship project
Tanja Karonen's Commentary on the Article:
This article provides valuable insights into how different reporting automation tools serve different business needs. One particularly important takeaway is that organizations should not choose a tool based solely on its features, but rather on where the biggest bottleneck in their reporting process actually lies.
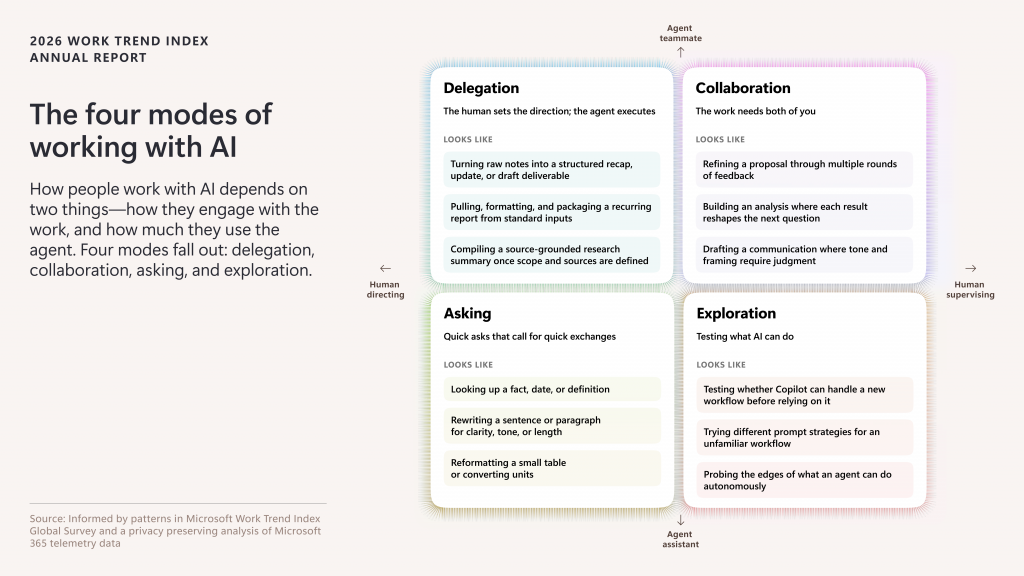
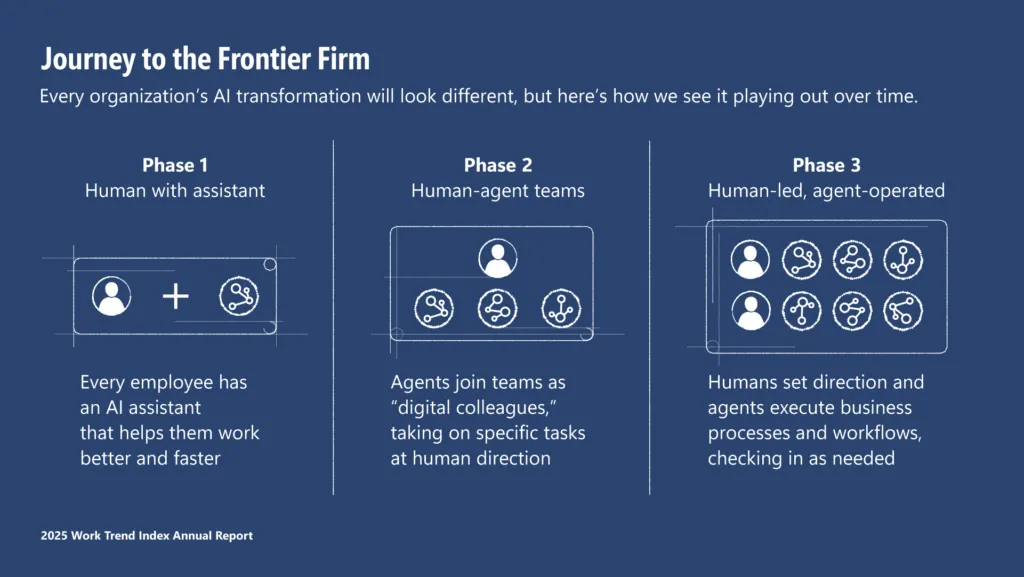
I would also like to add the perspective of artificial intelligence. Reporting is one of the areas where the impact of AI and automation can become visible in organizations very quickly. In many cases, manually compiled reports, endless Excel work, and recurring monthly presentations can be transformed into dynamic dashboards, automated summaries, and clearer decision-support views that update automatically.
This also requires organizations to adopt a new mindset and the willingness to embrace change. It takes the courage to explore how AI can work within *our own projects*. Reporting is not merely an administrative obligation—it is a management tool. When reporting is automated intelligently, people can spend less time searching for numbers and more time interpreting them to support better decisions.
I would also like to highlight a few tools for micro-businesses where AI is already becoming part of everyday operations:
* Sales & Customer Relationship Management: Notion
* Marketing: Sintra AI
* Financial Management: noCFO
* Recruitment: Jobilla
A good way to get started is to choose one specific report or KPI dashboard that is currently created manually. From there, you can evaluate whether the data could be updated automatically, whether the reporting view could be made more visual, and whether AI could help identify anomalies, trends, or actionable insights.
A Clear and Practical First Step
No AI Jargon!




 Finnish
  English
Leave a Reply